The Precision Edge: Rejection PPM Dashboard in Power BI for Manufacturing Quality
I. Introduction
Imagine a manufacturing floor where every defect tells a story, not just of a fault, but of why it happened, where it originated, and what specific action can prevent it from recurring. For too long, “quality control” often meant reactive firefighting – counting rejections, then painstakingly digging through data to find answers. This traditional approach isn’t just inefficient; it’s a silent drain on profitability, wasting precious time, and delaying crucial decisions.
But what if you could shift from reaction to anticipation? What if your quality data, sitting right there in your SAP BW system, could instantly translate into clear, actionable insights? This is exactly the transformation a Rejection PPM Dashboard in Power BI delivers. It’s not just a reporting tool; it’s your command center for proactive quality management, empowering manufacturing leaders to drive efficiency, cut costs, and uphold brand reputation with unprecedented speed and clarity.
II. What Exactly is Rejection PPM Dashboard?
“PPM” stands for Parts Per Million, a critical metric quantifying the number of defective units per million produced. But in isolation, PPM is just a number. A truly effective rejection PPM dashboard goes far beyond basic reporting. It’s a dynamic, visual command center that empowers your management to:
- Quickly pinpoint problem areas: See where quality issues are flaring up at a glance, eliminating the need for cumbersome manual reports.
- Drill into specifics: Investigate manufacturing plants, production lines, and even individual products, getting to the heart of an issue in seconds.
- Uncover root causes: Move beyond symptoms to understand the fundamental why behind rejections, allowing for permanent fixes rather than temporary band-aids.
- Drive corrective action: Make data-backed decisions that lead to real, measurable improvements, transforming reactive firefighting into a proactive strategy.
The best part? This entire system is fed live from your existing SAP BW system, ensuring you’re always working with the freshest, most accurate data. This means no more waiting for weekly reports, no more data reconciliation, just pure, actionable insight.
III. The Power of Insight: Revolutionizing Quality Control with Power BI
Here are some critical dashboards that spearhead this kind of transformation:
1. Strategic Supplier Performance: Identifying Strengths and Weaknesses
A common challenge for large manufacturers is effectively managing supplier quality without overwhelming manual labor. Traditionally, this involved days spent aggregating supplier defect rates from various systems.
A robust rejection PPM dashboard includes crucial components like:
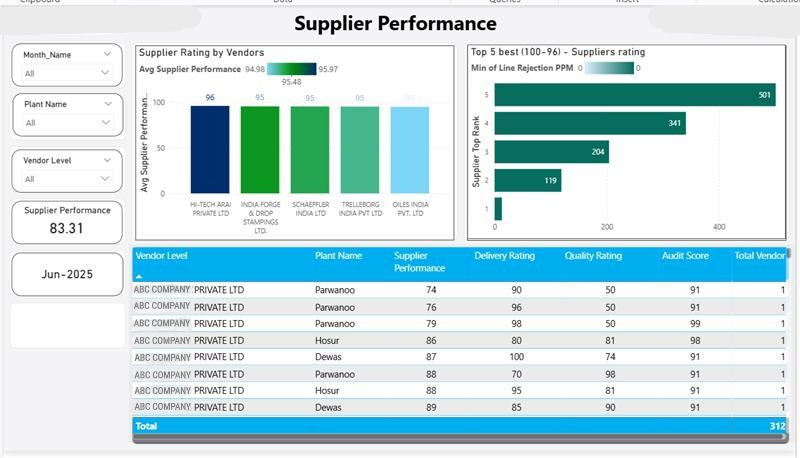
- Supplier Performance Dashboard: This visual provides an immediate overview of your best-performing suppliers based on the lowest rejection PPM. It allows procurement and quality teams to quickly identify reliable partners, streamlining future sourcing decisions, and recognizing strong performers.
- Supplier Least Performance Dashboard: Conversely, this dashboard highlights suppliers with the highest rejection PPM. This isn’t about blame; it’s about precision. Instead of general concerns, organizations can now identify specific problematic suppliers impacting their production, initiating targeted discussions and corrective action plans without delay. This eliminates hours of manual data compilation, allowing teams to focus on problem-solving.
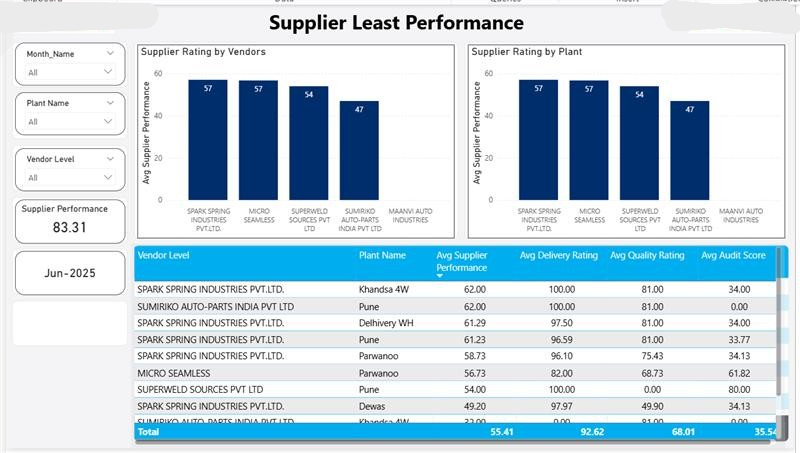
Understanding who or what is performing poorly is only half the battle. The real breakthrough comes from understanding why. The traditional process often involves multiple department handoffs and extensive manual research to determine root causes for rejections.
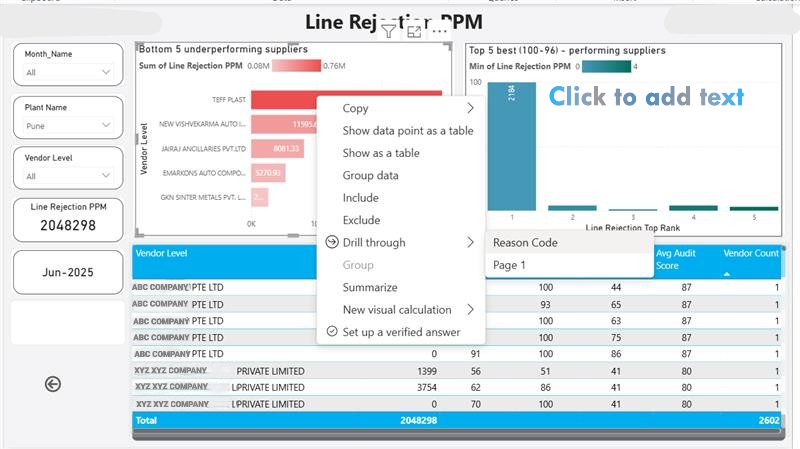
An interactive Power BI dashboard with advanced drill-down capabilities can change this:
- Drill-Down Action with Variable Reason Codes: This dashboard allows management and quality engineers to click on a high-PPM plant or product and instantly drill down to see the exact rejection reasons associated with those defects. This isn’t a static report; it’s a dynamic investigation tool.
- Various Reasons with Code Details: Beyond just category, this visual presents granular details, allowing teams to see the specific defect codes (e.g., “Material Imperfection – Batch 123”, “Operator Error – Shift C”). This level of detail eliminates ambiguity and accelerates the root cause analysis (RCA) process. For instance, if a specific material defect code repeatedly appears, it immediately flags a supplier or process issue, saving countless hours previously spent sifting through reports and interviewing personnel. This direct link between symptoms and causes significantly increases problem-solving efficiency.
Even within a single supplier relationship, performance can vary significantly across different product lines or components. Manufacturing organizations need a way to monitor these subtle shifts to prevent major issues.
A targeted trend analysis dashboard is essential here:
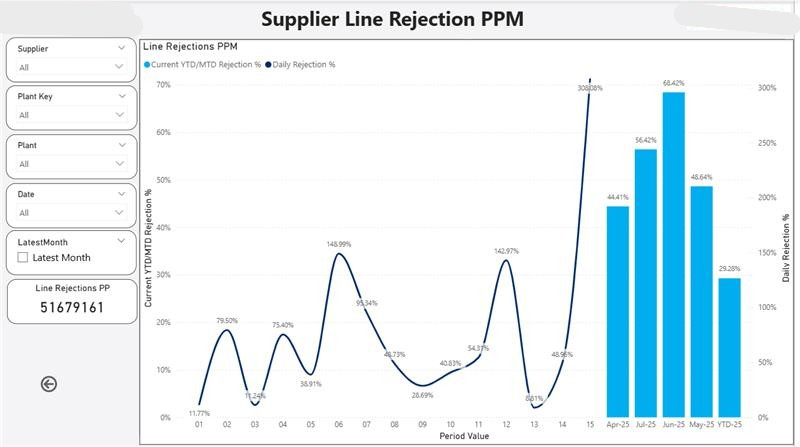
- Supplier Line Rejection PPM Graph:
This dynamic line chart tracks the rejection PPM for specific product lines or components supplied by key vendors over time. It allows organizations to spot emerging trends – a gradual increase in rejections from a particular supplier line, for example – before it escalates into a major disruption. This proactive monitoring can significantly reduce reactive quality crises, saving substantial costs related to rework, scrap, and production delays. It transforms supplier management from reactive crisis control to proactive partnership.
The Data Backbone: Why SAP BW Data is Key
All these powerful insights don’t come from magic; they come from reliable, structured data. This rejection PPM dashboard is meticulously powered by live, accurate data directly from your SAP BW (Business Warehouse) system. This means:
- Real-time Accuracy: Your dashboard reflects the current state of operations, not outdated spreadsheets, ensuring decisions are based on the latest facts.
- No Manual Work: Say goodbye to time-consuming, error-prone manual data uploads, freeing up valuable personnel for analysis and improvement.
- Seamless Integration: Power BI connects directly to your existing SAP BW queries, ensuring a smooth, reliable data flow that aligns with your ERP system, providing a single source of truth.
Why This Dashboard Matters to Manufacturing Leadership
For decision-makers navigating the complexities of manufacturing, this dashboard isn’t just a nice-to-have; it’s a strategic imperative. Organizations that implement such solutions typically see a dramatic reduction in manual reporting time, a significant increase in the efficiency of their quality teams, and a newfound ability for management to make informed, data-driven decisions swiftly.
- Too much data, not enough insight: Summarizes key quality metrics visually and intuitively.
- Delayed Root Cause Analysis (RCA): Allows instant drill-down to pinpoint problems quickly.
- Supplier accountability issues: Ranks suppliers by actual defect data, fostering objective review.
- Poor visibility across plants: Compares plant and line-level performance with ease.
- No feedback loop on improvements:Tracks progress over time via trends, measuring initiative impact.
Final Thoughts: Your Next Step Towards Quality Excellence
The Rejection PPM Dashboard is more than just a report; it’s a powerful decision-making engine. It empowers:
- Operations teams to detect and resolve issues faster, reducing scrap and rework.
- Procurement to manage supplier quality proactively, optimizing supply chain reliability.
- Leadership to track critical quality KPIs and ensure targets are met, fostering a culture of continuous improvement across the entire organization.
With SAP BW as the robust data backbone and Power BI as the intuitive visual brain, this dashboard brings unparalleled clarity, speed, and actionable insight to your entire quality control strategy.
At Codeplateau, we specialize in Power BI dashboard development and Power BI consulting services for the manufacturing sector. We help companies like yours leverage their SAP BW data to create intelligent, custom solutions that drive real results.